Our Patent Examiner Reports give attorneys, agents, and in-house teams nearly limitless advantages over the competition. Every time you open an Examiner Report, our system performs over a billion calculations to return the most up-to-date information. As of this writing,
Juristat’s database covers approximately 9,000 active examiners in almost 900 art units. Not only that, we have data on nearly 8 million patent applications.
In this series of posts, we will go step-by-step through an Examiner Report and demonstrate just how useful Juristat can be.
WHAT IS AN EXAMINER REPORT?
In a nutshell, an Examiner Report is an interactive tool that helps attorneys and agents predict examiner behavior. If you understand your examiner's past, you understand your examiner's future. These reports provide actionable insights that help practitioners impress clients, partners, and (of course) patent examiners.
FILTERS
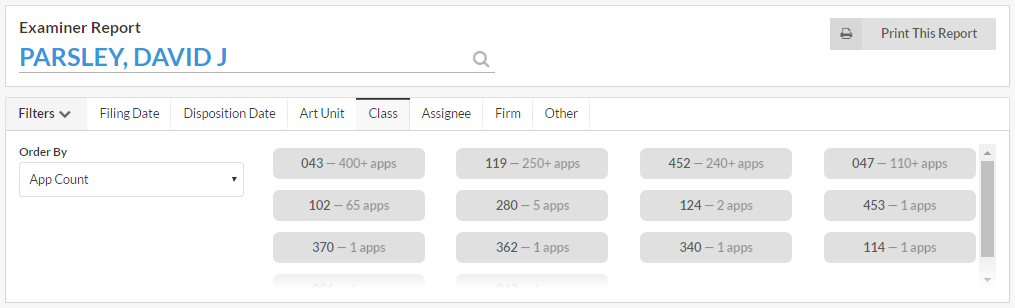
Let's start at the top. Every Examiner Report can be filtered by filing date, disposition date, art unit, class, assignee, firm, and more. Filters let you tailor the information to your specific needs.
Most of the filters are self-explanatory, but let's take a closer look at a couple to see how they work. Before even applying a filter, you can glean valuable information simply by noting the available options. Consider the Class tab. As you can see in the image above, this tab instantly shows you where Examiner Parsley is practicing and how many applications he has handled in each class. The Art Unit tab similarly divides the data by tech center and art unit group. To fully understand what you're up against, simply select your class or tech center for a more granular view of your examiner's behavior.
EXAMINER DETAILS & APPLICATIONS OVER TIME
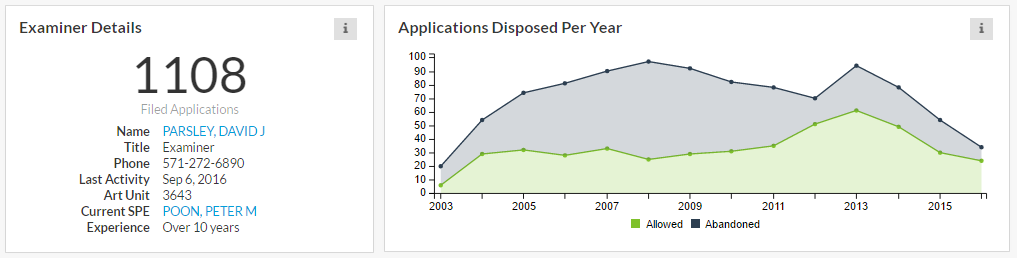
Each report starts with an Examiner Details section in the upper left. This box covers the basics: total number of filed applications, title, phone number, date of last activity, most recent art unit, current SPE, and estimated experience. To the right you'll find Applications Disposed Per Year. This graph provides yearly totals for the number of allowed and abandoned applications. This gives you an idea of the examiner's trend over time. To see the number of applications by filing year, simply click the "i" icon, and select Show By Filing Year.
KEY METRICS
Timings
This is where things get exciting. The Average Number of Months Between Key Events table provides quick statistics on your examiner's average timings. In the example below, we see that Examiner Parsley takes, on average, 18.7 months between filing and the first office action. Other timing statistics include FIling to Disposition, RCE to Office Action, Notice of Appeal to PTAB Decision, and Notice of Appeal to Non-PTAB Disposition.
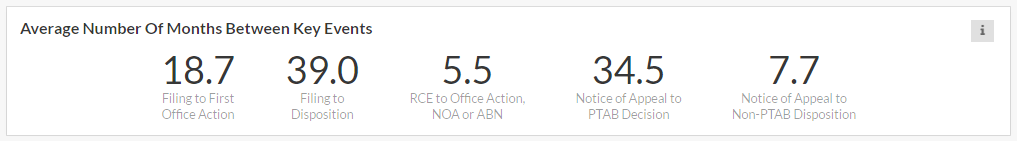
Why does any of this matter? I'm glad you asked. Timing data allows you to budget effectively and manage client expectations (themes you will see again and again in these posts). Of course, sophisticated clients understand the USPTO isn't the fastest organization on the planet, but these numbers let you give better estimates of what to expect. Additionally, if time is of the essence, this data helps you choose the course of action that best fits the client's timeline.
An informed client is a happy client and happy clients come back.
Allowance Rates, Office Actions, and Dispositions (Oh My!)
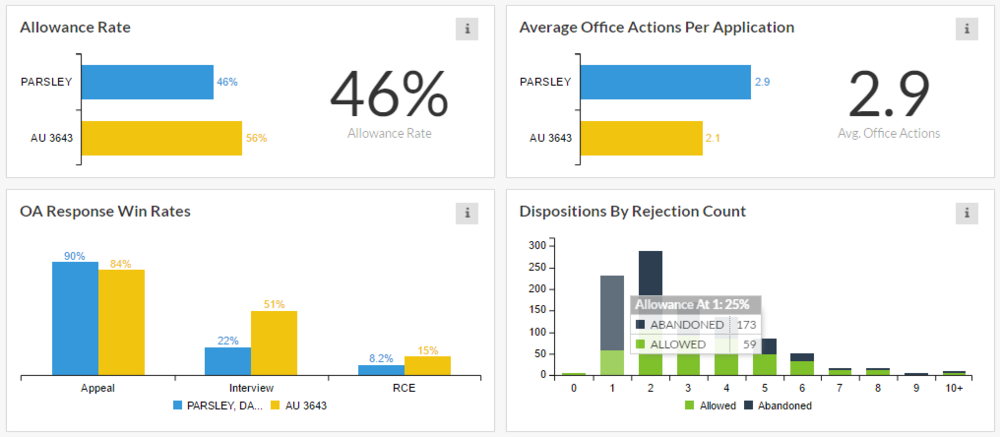
Of course, every Examiner Report includes allowance rate data. The term “allowance rate” refers to the percentage of applications a particular entity has allowed over a given period of time. Every Juristat report provides the allowance rate of the examiner and his/her art unit. Here, Examiner Parsley has an allowance rate of 46%. His art unit's allowance rate is 56%. At a glance, you realize you're up against a challenge. The good news is you can show this to your client, meaning they are less likely to blame you if it doesn't work out.
Our Examiner Reports also include Average Office Actions Per Application and Office Action Response Win Rates. The former tells you how many rounds of prosecutions to expect while the latter breaks down the effectiveness of each response type. Here, you can expect around 2.9 rounds of prosecution with an appeal being your best avenue for success. Of course, appeals are expensive and time consuming. Our data helps you justify the strategy to your client.
The Dispositions by Rejection Count chart shows you the examiner's average allowance rate after a given number of rejections. This helps you answer that nagging question: "Is it worth continued money and time?" For Examiner Parsley, the answer is yes. His allowance rate is just 36% after the second rejection. That percentage increases to 63% in round six. In this case, persistence is rewarded.
 A Note on Win Rates
We get a lot of questions about what it means to "win" an office action response. Here are some quick notes for reference:
- An RCE is "won" when followed by an allowance without an intervening event.
- An interview is also "won" when followed by an allowance without an intervening event.
- An appeal is "won" when the examiner is reversed (whether in whole or in part), the examiner withdraws rejection, the examiner reopens prosecution, or the application is allowed.
So a win rate is simply the frequency at which a particular response is successful under those definitions.
TRY IT OUT
That's a lot of powerful information. Using just this section, you can formulate a strategy, estimate expense, create a budget, and justify it all to your client. Check out Part II to learn more or try it for yourself by clicking the button below.

SOME FAQS
How does Juristat work? Our reports are the result of years of work by lawyers, computer scientists, and business professionals. Juristat’s proprietary algorithm organizes raw USPTO data and turns it into insights that allow users to predict an examiner’s future behavior.
But we can't choose our examiner. That’s right. You can’t. Nevertheless, Juristat can help you navigate the prosecution process in ways that maximize your chance of success. Patent prosecution is made up of hundreds of critical decisions like what office actions to take, what arguments to make, and which claims to amend. Let Juristat help.
Won't my application be decided on the merits? In an ideal world, yes. However, examiners are people and people have biases. An examiner’s particular history and skill-level often play a role. In other words, not all examiners are created equally. For example, there are art units in which examiner allowance rates differ by 80%! With our examiner reports, lawyers can avoid surprises and create prosecution strategies tailored for any situation.
I’ve worked with these examiners before. Won’t your reports tell me what I already know? Nope. Assumptions based on a handful of past experiences are no substitute for concrete data. Why guess when you can know? By looking at examiner data in the aggregate, attorneys can adjust their prosecution strategies, thereby maximizing efficiency and effectiveness.
How often do you update your data? We download updates to applications daily. Every time a user opens an Examiner Report, our system performs over a billion calculations to return the most up-to-date information.

Editor's Note: This post was originally published in January 2015 and has been updated to reflect exciting new changes in our Examiner Reports.