In Part I of our Using Juristat's Examiner Reports series, we explained how understanding an examiner's key metrics can help you estimate expense, allocate resources, and manage client expectations. In this post, we'll take a closer look at responding to office actions, including interviews, appeals, and the effects of filing a continuation or continuation-in-part.
Effects of Continuation or Continuation-in-Part
Here at Juristat, we know that continuations and CIPs can be filed strategically to change examiners or art units. That's why we created the Effects of Continuation and Effects of Continuation-in-Part sections. Consider Examiner Parsley and his art unit. An applicant who files a continuation has a 13% chance of getting a new examiner and a 5.5% chance of changing art units. That's not very encouraging. However, an applicant who files a continuation-in-part has a 41% chance of ditching Examiner Parsley and a 30% chance of getting a different art unit. If your primary purpose behind filing either of these motions is to get away from your examiner or art unit, a continuation-in-part is the much better option in this instance.

Effect of Interview
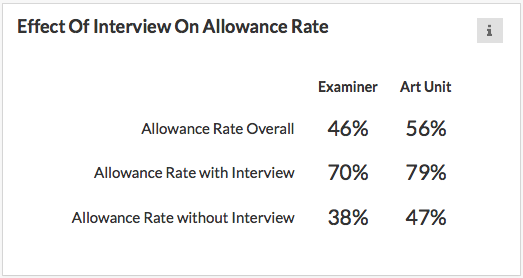
Similarly, the Effect of Interview on Allowance Rate section measures the effect that interviewing your examiner will have on your allowance rate for both your examiner and art unit. In most cases, an interview causes allowance rates to go up. For example, practitioners who interview Examiner Parsley have allowance rates that are a whopping 32 percentage points higher than those who do not.

Appeals
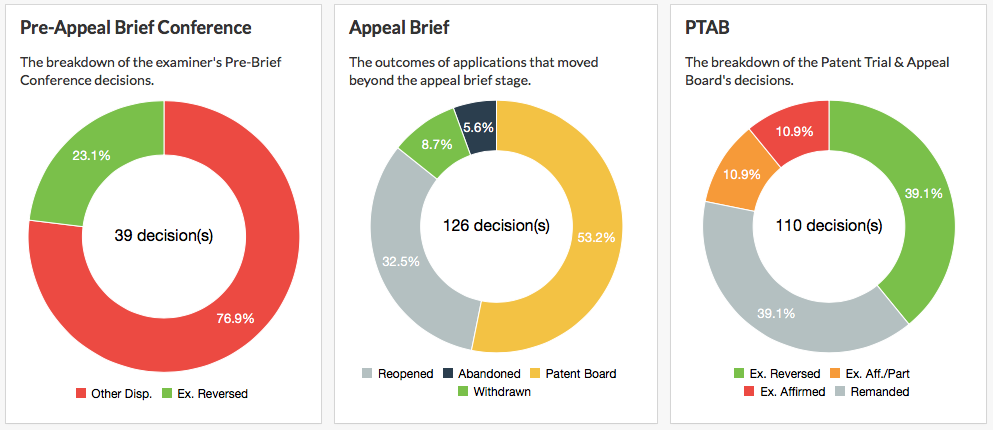
Juristat Examiner Reports offer a variety of tools to assist applicants in handling an appeal. Before you even begin the appeal process, you should be aware of how far you are likely to get--whether you are good to go with a pre-appeal brief conference, or if you will need to go all the way to the PTAB. That's where Juristat's Appeal Outcome Graphs come in handy. Looking at Examiner Parsley's appeal outcome graphs, we see that only 23.1% of pre-appeal brief conference decisions are successful, while over half of the appeal briefs go to the PTAB.

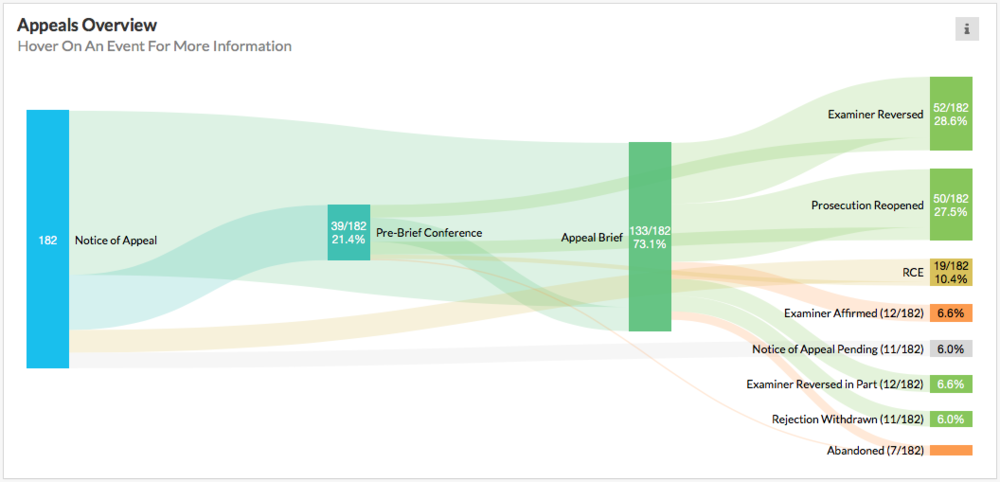
Another useful tool when undertaking an appeal is the Appeals Overview flow graph, which works as a visual roadmap of what you, the applicant, can expect at every stage of the appeals process. It is meant to be read from left to right. Looking at Examiner Parsley's appeals flow graph, it looks like very few appeals (21.4%) are resolved at the pre-brief conference, with most of them moving in to the appeal brief stage (73.15). Of those, Examiner Parsley was reversed only 28.6% of the time. When paired with the information from above, an appeal from Examiner Parsley is likely to be a long and difficult process.
As we mentioned in Part I, An appeal is "won" when the examiner is reversed (whether in whole or in part), the examiner withdraws rejection, the examiner reopens prosecution, or the application is allowed.

Detailed Outcomes Flow Graph
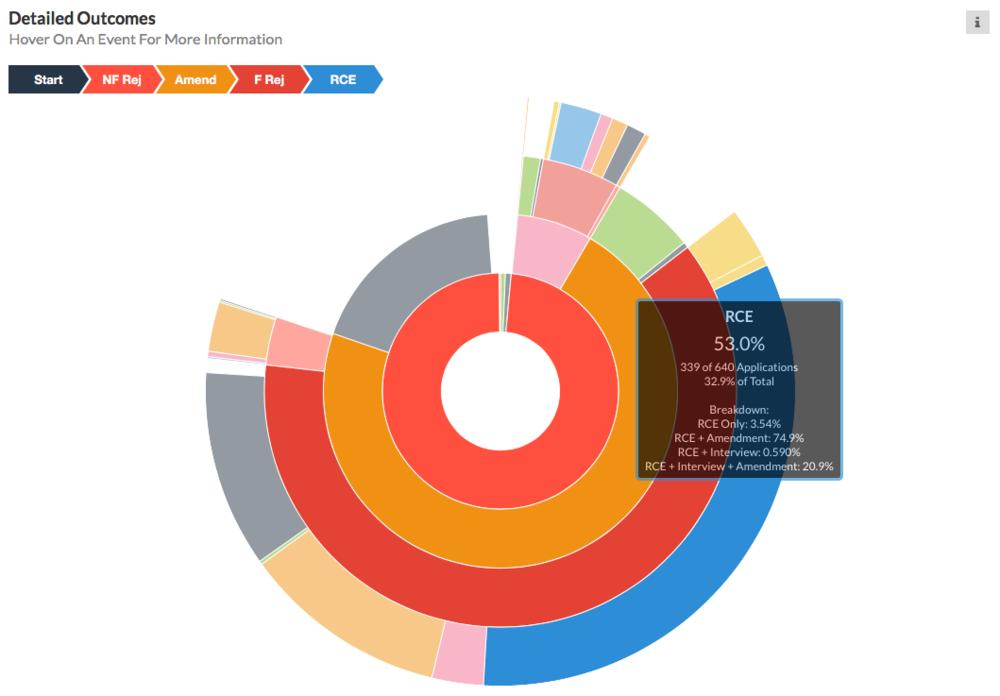
The Detailed Outcomes flow graph is the heart of our office action response analytics.
It displays the rates at which significant actions and outcomes occur at each stage of patent prosecution before every examiner. Each segment corresponds to a particular action and what happened next. For example, the center segment shows that the first action on the vast majority of applications before this examiner is a non-final rejection. Moving outward, you can trace the outcomes of every response to that first non-final rejection through an amendment, a final rejection, an RCE, and on and on until every application is either allowed or abandoned.

Stay tuned for Using Juristat Examiner Reports Part III, where we will outline the Historical Analysis aspect of Examiner Reports and how practitioners can use an examiner's past behavior to craft arguments that win.
Editor's Note: This post was originally published in January 2015 and has been updated to reflect exciting new changes in our Examiner Reports.
(gradient).webp)
