
Procrastination. We all do it. In-house counsel do it, OCs do it, and USPTO examiners do it. In fact, some examiners procrastinate a lot.
Specifically, they wait until the end of the quarter to do an inordinate amount of work for the time remaining. The USPTO knows this happens and calls the phenomenon “end-loading.”
Now, with Juristat, you can track how much your individual examiner end-loads and how the probability of them granting an allowance changes (positively or negatively) at the end of the quarter due to this procrastination.
Let’s introduce how these new metrics work:
End-Loading Rate:
Does your examiner do more work at the end of the quarter?
We define an examiner’s end-loading rate as the percentage of i) notices of allowance (NOAs) and ii) adverse office actions completed by the examiner in the last 3 weeks of the quarter minus 3/13ths.
Let’s unpack all of those factors. First, we count the number of office actions (OAs) – specifically, NOAs, non-final rejections, final rejections, Ex parte Quayles, and restriction requirements – to track the work completed by the examiner on each day. Second, we isolate work completed in the last 3 weeks of the quarter because, based on our analysis of the last 5 years of prosecution data, those are the weeks where we see the biggest spikes in OAs. (Note that determining when work is completed in the last 3 weeks of a quarter is more nuanced than most realize. While I’m sure copycat metrics will soon hit the market, they will be off until they realize how to account for certain inconsistencies in USPTO data as we have.) Finally, we subtract 3/13ths of the OAs completed in the last three weeks of a quarter, since we would expect an examiner who is guilty of zero end-loading to file 3/13ths of their OAs in the last 3 weeks of a 13-week quarter.
Here’s what this metric looks like with real data. Below are the 10 examiners who, on average, end-load the most at the USPTO. For this analysis, we excluded design patent examiners and SPEs, but included all those who filed at least 100 OAs over the past three years (2016-2019) to ensure we had a significant sample size for each individual.
And, before anyone thinks this blog post is meant to embarrass the USPTO and its examiners, we’ve also highlighted the 10 examiners who end-load the least. These examiners are such anti-procrastinators that they have the most negative end-loader rates. Kudos.
It’s probably also worth noting that, out of the 7,750+ examiners who met our evaluation criteria, over 52% of examiners had end-loading rates of 1% or less. That is really an incredible number, and the USPTO should be commended for it. Nevertheless, there are still approximately 670 examiners who are end-loading by 10 percentage points or more.
Furthermore, just because an examiner doesn’t procrastinate doesn’t mean their behavior or relative difficulty doesn’t change in the last three weeks of a quarter. This is where our other two metrics come in: OA success rate and end-loading OA success rate change.
OA Success Rate:
What is the probability that the examiner will grant an allowance as your next OA?
While we often use allowance rate to quantify examiner difficulty, here we’re getting even more specific. Allowance rate is the probability of getting an allowance at any point in prosecution. OA success rate is the probability of getting an allowance as your next OA. Moreover, allowance rates take abandonments into consideration (NOAs / (NOA + ABN). But, since we’re trying to measure only examiner behavior here, and examiners don’t control when to file an abandonment, it doesn’t make sense to use allowance rate.
We define an examiner’s OA success rate as how many allowances they issue as a ratio of the total OAs they issued. Put simply, NOAs / Totals OAs.
So an examiner that had 10 NOAs and 6 adverse office actions has a OA success rate of 62.5% based on the formula: (10 / (10+6)). Thus, an examiner with a OA success rate of 100% only files NOAs, while another examiner with a OA success rate of 0% never files NOAs.
CLICK HERE TO DOWNLOAD THE WEBINAR: Advanced Examiner Analytics for Smarter Patent Prosecution
End-Loading OA Success Rate Change:
Does the probability of your examiner granting an allowance change at the end of the quarter?
This metric looks specifically at how an examiner's OA success rate changes in the last three weeks of a quarter. Does an examiner become substantially easier, granting more allowances to get work off their plate? Or do they become substantially harder, issuing more rejections to pump up their counts?
It’s a key consideration that every practitioner should know about their examiner. To calculate end-loading OA success rate change, we measure the average OA success rate for an examiner in the last three weeks of each quarter over the last three years and subtract their average quarterly OA success rate over the same period. For those who prefer math formulas, it looks like this:

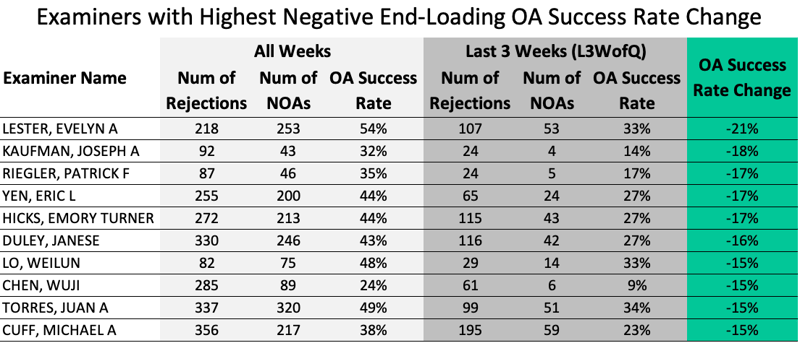
As such, an examiner with a highly negative end-loading OA success rate change becomes much harder at the end of a quarter, issuing fewer NOAs as a percentage of total OAs. Below, we’ve highlighted examiners with at least 25 OAs issued in the last three weeks of a quarter who also had the highest negative end-loading OA success rate changes.
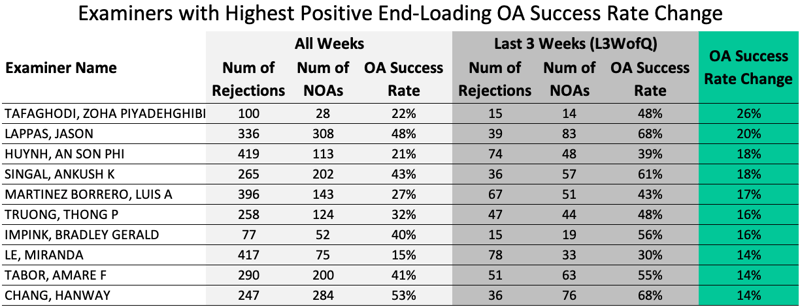
Conversely, an examiner with a highly positive end-loading OA success rate change is much easier during the last three weeks of a quarter, issuing a higher number of NOAs as a percentage of total OAs. Below, we’ve highlighted examiners with at least 25 OAs issued in the last three weeks of a quarter who also had the highest positive end-loading OA success rate changes.
While we’re highlighting the outliers here, we would be remiss to not acknowledge the 1,694 examiners with end-loading OA success rate change metrics between 1% and -1%. These balanced examiners don’t become easier or harder in the last three weeks of the quarter – they maintain their standards even in crunch time. We applaud that predictability and dependability.
Understanding examiner end-loading behavior can help you make more strategic prosecution decisions, getting you closer to an allowance and ultimately, saving money for your client. Let’s say, for example, you discover your examiner becomes substantially easier at the end of the quarter and they have a high allowance rate on interview. Well, it may just be worth picking up the phone to have an interview in the next few weeks. You can now find end-loading and OA success change data on every examiner in Juristat’s industry-leading examiner reports.
For years, Juristat has helped practitioners decide what OA strategy to employ, now we can help you decide when to execute on that strategy. These metrics bring even more transparency and predictability to patent prosecution – and now all three are just a few clicks away within Juristat.
