
The USPTO has an official term for examiner procrastination - end-loading. An interesting metric to be sure, but how can you use examiner procrastination to your advantage in patent prosecution?
We’re all busy people, and busy people procrastinate. It’s an inevitable part of professional life. And now with Juristat, you can track examiner procrastination and how the probability of them granting an allowance changes (positively or negatively) at the end of the quarter.
Does your examiner wait to do more work at the end of the quarter?
We define an examiner’s end-loading rate as the percentage of i) notices of allowance (NOAs) and ii) adverse office actions completed by the examiner in the last 3 weeks of the quarter minus 3/13ths. (Why 3/13ths? We subtract those because we would expect an examiner who is guilty of zero end-loading to file 3/13ths of their OAs in the last 3 weeks of a 13-week quarter.)
Below are the 10 examiners who, on average, end-load the most at the USPTO. For this analysis, we excluded design patent examiners and SPEs, but included all those who issued at least 100 OAs over the past three years (2017-2020) to ensure we had a significant sample size for each individual. This analysis is based on data acquired from Juristat in May 2021.
And, before anyone thinks this blog post is meant to embarrass the USPTO and its examiners, we’ve also highlighted the 10 examiners who end-load the least. These examiners are such anti-procrastinators that they have the most negative end-loader rates.
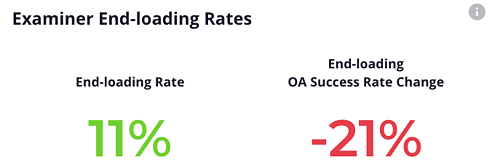
It’s probably also worth noting that, out of the 8,270+ examiners who met our evaluation criteria, over 56% of examiners had end-loading rates of 1% or less. That is really an incredible number, and the USPTO should be commended for it. Nevertheless, approximately 7% of these examiners have an end-loading rate of 10% or higher.
Furthermore, just because an examiner doesn’t procrastinate doesn’t mean their behavior or relative difficulty doesn’t change in the last three weeks of a quarter. This is where our other two metrics come in: OA success rate and end-loading OA success rate change.
What is the probability that the examiner will grant an allowance as your next OA?
While we often use allowance rate to quantify examiner difficulty, OA success rate gets even more specific. Allowance rate is the probability of getting an allowance at any point in prosecution. OA success rate is the probability of getting an allowance as your next OA.
We define an examiner’s OA success rate as how many allowances they issue as a ratio of the total OAs they issued. Put simply, NOAs / Totals OAs.
CLICK HERE TO DOWNLOAD THE WEBINAR: Advanced Examiner Analytics for Smarter Patent Prosecution
Does the probability of your examiner granting an allowance change at the end of the quarter?
Our end-loading OA success rate change metric looks specifically at how an examiner's OA success rate changes in the last three weeks of a quarter. Does an examiner become substantially easier, granting more allowances to get work off their plate? Or do they become substantially harder, issuing more rejections to pump up their counts?
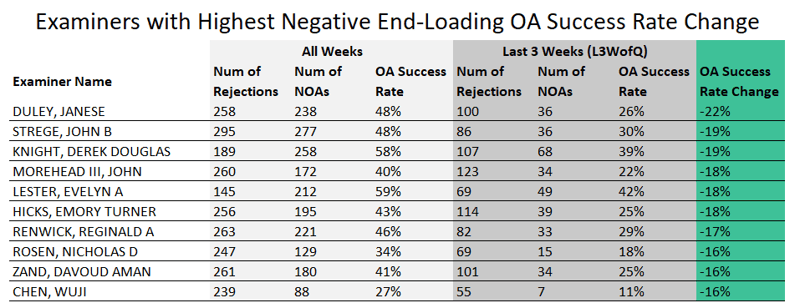
An examiner with a highly negative end-loading OA success rate change becomes much harder at the end of a quarter, issuing fewer NOAs as a percentage of total OAs. Below, we’ve highlighted examiners with at least 25 OAs issued in the last three weeks of a quarter who also had the highest negative end-loading OA success rate changes.
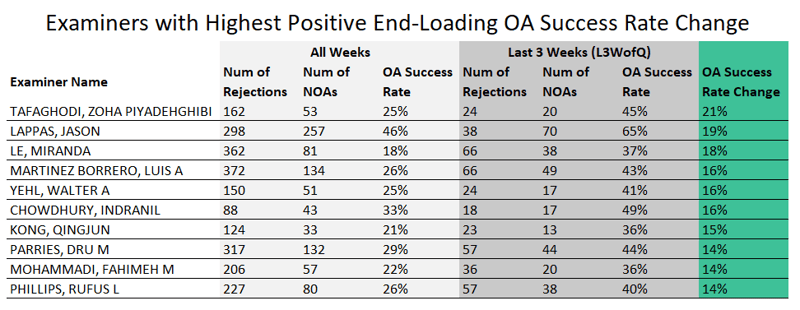
Conversely, an examiner with a highly positive end-loading OA success rate change is much easier during the last three weeks of a quarter, issuing a higher number of NOAs as a percentage of total OAs. Below, we’ve highlighted examiners with at least 25 OAs issued in the last three weeks of a quarter who also had the highest positive end-loading OA success rate changes.
While we’re highlighting the outliers here, we would be remiss to not acknowledge the 1,683 examiners with end-loading OA success rate change metrics between 1% and -1%. These balanced examiners don’t become easier or harder in the last three weeks of the quarter – they maintain their standards even in crunch time. We applaud that predictability and dependability.
Understanding examiner end-loading behavior can help you make more strategic prosecution decisions, getting you closer to an allowance and ultimately, saving money for your client. Let’s say, for example, you discover your examiner becomes substantially easier at the end of the quarter and they have a high allowance rate on interview. Well, it may just be worth picking up the phone to have an interview in the next few weeks. You can find end-loading and OA success change data on every examiner in Juristat’s industry-leading examiner reports.
Many of the industry’s leading IP practitioners already use Juristat to decide what OA strategy to employ, and with these end-loading metrics, we help determine the most optimal time to execute that strategy. These metrics bring even more transparency and predictability to patent prosecution – and all three are just a few clicks away within Juristat.
