.png)
Data visualization is all about telling a story with data, recognizing trends and patterns that can help you in your decision making. But you don’t want to lose time struggling to uncover the meaning in all the charts and graphs.
Imagine a tool that takes that visual information and tells you what it means, how it affects your bottom line, and how you can act on it. Today, we’d like to introduce our Dashboards for Prosecution Metrics and ROI.
Improving on our already industry-leading reporting capabilities, we built these dashboards so that IP professionals can get exactly the information they need in a fraction of the time. Put valuable data in front of your team in a quick, digestible format, making it easier than ever to make data-driven decisions.
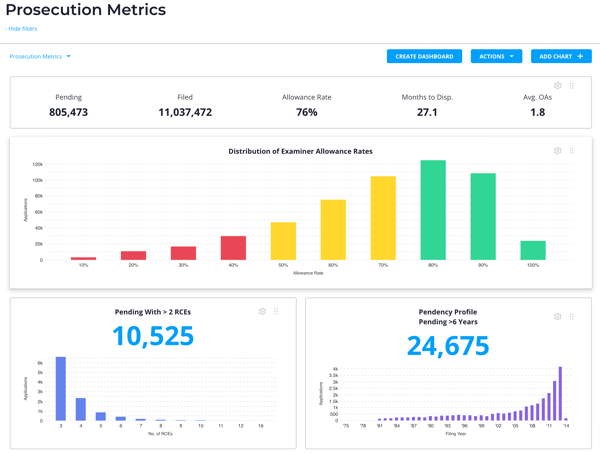
New! Prosecution Metrics Dashboard
With our Prosecution Metrics Dashboard, you can develop prosecution strategies and track the performance of your applications (or your outside counsel), all from one central view. Quickly identify applications going through the longest prosecution and consider if they are worth the time and resources.
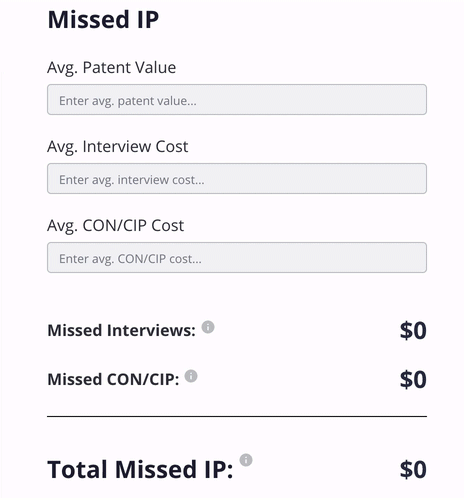
New! ROI Metrics Dashboard
With our new ROI Dashboard, we’ve developed a series of metrics to help your firm or company curb excessive spending as well as increase IP value. These calculations show how unnecessary office actions or appeals impact cost and how interviewing or filing a continuation or continuation-in-part impacts IP value. It’s an at-a-glance report that can have a big impact on your revenue.
Want to see these new dashboards in action? Schedule a demo today or watch our Master Class introduction of these features.
